BlogWhen the Client Asked Me to Make the Lines to Go Up in Her Chart

Many of us have that experience with a special customer who wants impossible. Well, we say that nothing is impossible with IT Sapiens! At least, that is what we always aim for as "no limits" is our team’s internal motto.
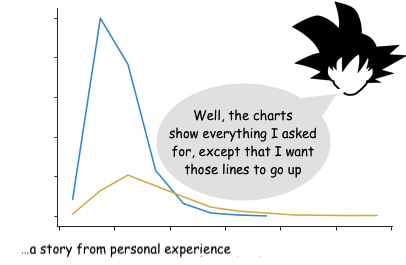
But then we met that special very powerful lady, the VP of a Mortgage Company. We got the Devil from the details of data in order to create charts containing all that she asked for. The moment of truth comes, when she looks at it all. And then she says: "Well, the charts show everything I asked for, except that I want those lines to go up instead of down".
After an awkward silence I have to answer that "We can't lie with the Analytics. It shows your Business situation according to the data". Did we get the lines to go up eventually? Oh, yes, we did!
If you have a good Analytic Tool, it should enable you with a simple click on a point of the line, to drill down to the detailed data behind. That allows you to easily see and fix potential issues with the data quality or see the drivers behind the summary number. By identifying and applying necessary filters to the report, one should be able to slice and dice the data to finally see the necessary outcome.
The VP found quite surprising discoveries as we went through the process. Apparently there was a specific issue with a certain product group that messed-up not only the data, but her Business growth as well. So with the help of Intelligent Analytics she could make the necessary decisions to change her Business and make the lines in the charts to go up - for real!
Eva Narunovska,
CEO of IT Sapiens
