Video Tutorial: When Should You Use Line Charts?

If you cannot measure it, you cannot improve it is a popular quote that seems to have made it to an increasing number of inspirational posters. As cliché as it is, it is truly at the base of everything we do – we enable our clients to extract intelligence from their data. Sapiens.BI users can measure different KPIs so that they can make informed business decisions and ultimately grow their business.

We made a video tutorial on how to create another chart type – the Line chart. Line charts are most commonly used to see how your data developed over time. You can see how different data categories compare and identify trends.

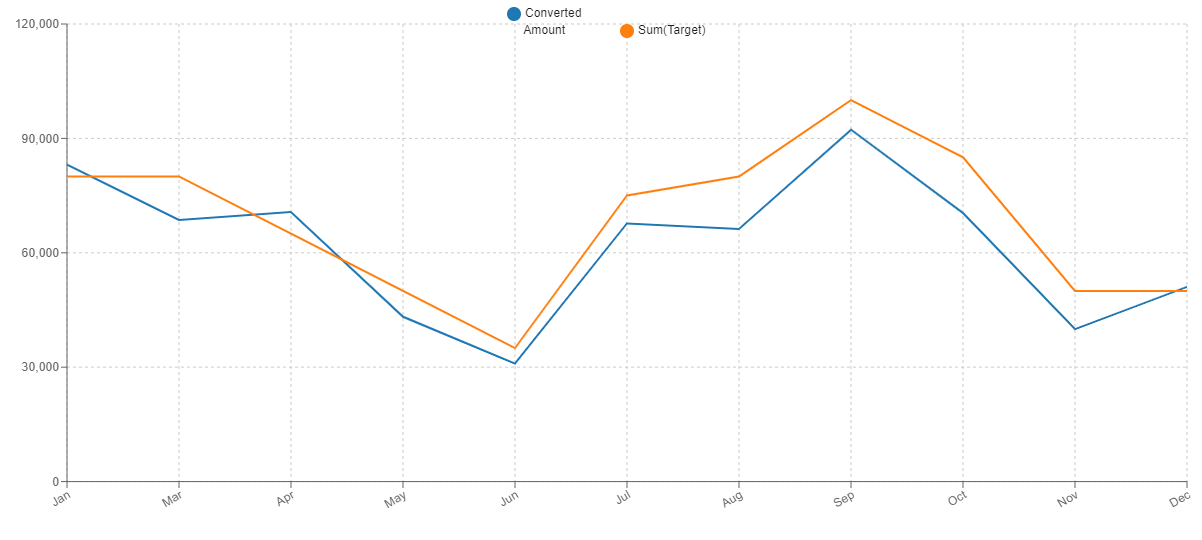
You can set up charts that compare two categories – such as the Converted Amount sum against a Target amount.

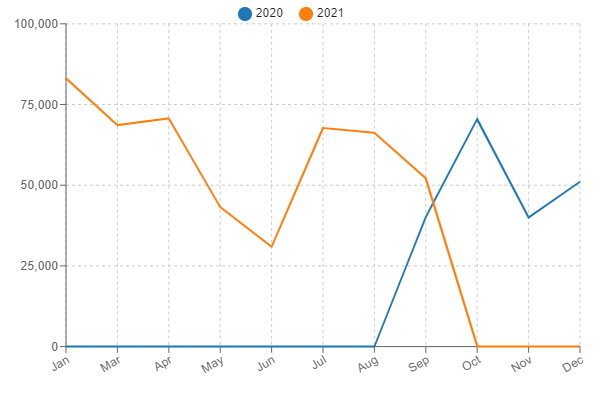
You can also compare how sales or other metrics change over multiple years.

Watch this video tutorial to learn how to set up a Line Chart.

To see the full playlist of all our tutorials for SuiteCRM and SugarCRM click here.

We love Sapiens.BI. It is instrumental in helping our sales team increase their productivity by providing us custom, real-time key performance metrics and making these stats easily visible. Sapiens.BI provides excellent technical support and always go above and beyond to answer any questions we have.

The system has been ‘live’ for one month now and we are already benefitting from the features of Sapiens.BI both for day-to-day management information and, in particular, for the detailed statistical analysis of our services that is required by the organizations that provide financial support for the charity. Based on our experience of the product and your excellent customer service, we would have no hesitation in recommending Sapiens.BI to potential users.

Comprehensive tool that allows all types of advanced reports including audit tables, custom fields and combined reports. The developers offer fast and efficient support. Great tool!

Great support & implementation from the team. Graphs look beautiful!

Excellent work, communications and skills from developers; I appreciate all effort, commitment and work.

Your report generator ROCKS! Wish I had found it before investing in some other rubbish!

I'm extremely excited about Sapiens.BI. We've been using it for about a month and it's by far the best available reporting tool for SugarCRM. The tool is very robust and full of features. Also, the staff and support team are very helpful and are continuing to improve the tool.

We have bought the latest version of Sapiens.BI and it is a fantastic product for Vtiger CRM. By using this I have stopped our remote users having to send external paperwork. Would recommend Sapiens.BI to any users using Vtiger CRM.